
MT5 Strategy Tester • DukasCopy • Up to 10 Years
Forex Backtesting Results
(2019–Present) — Every-Tick, Risk-First
We optimize for drawdown and Sharpe—not screenshots. Explore pair-by-pair results using Dukascopy tick data.
Trusted By Traders Worldwide


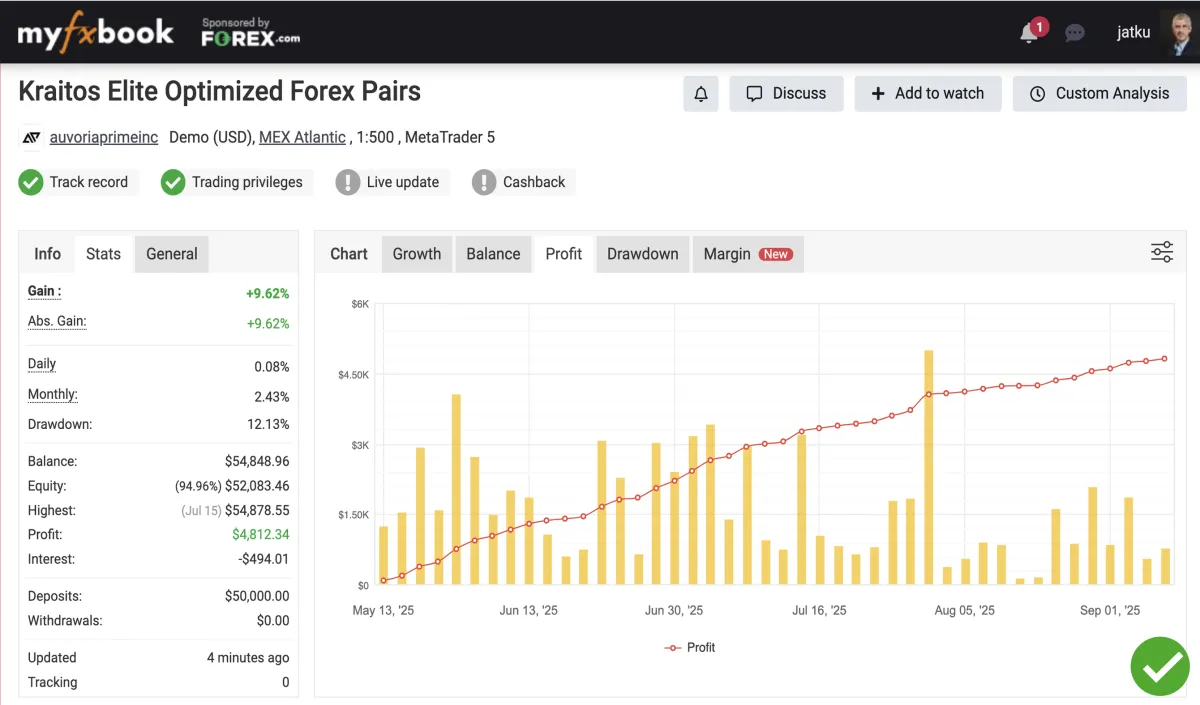
MyFXBook Verification
6 Years of Consistency
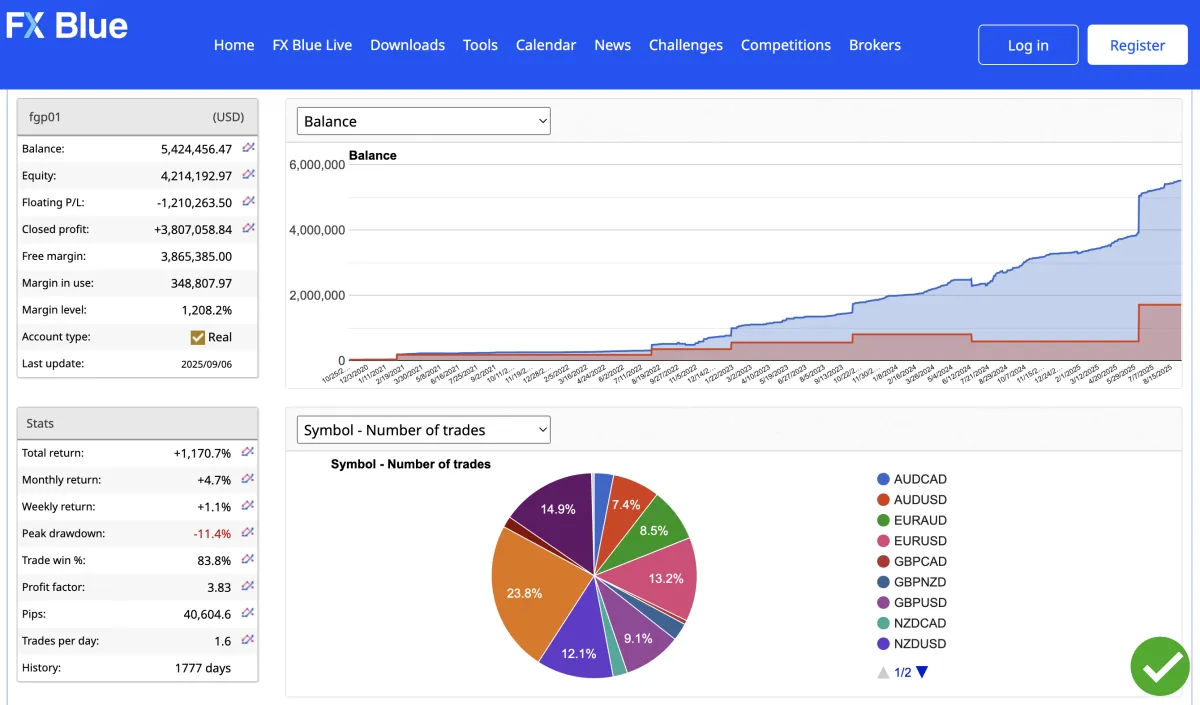
FXBlue Fund
Live Performance Proof
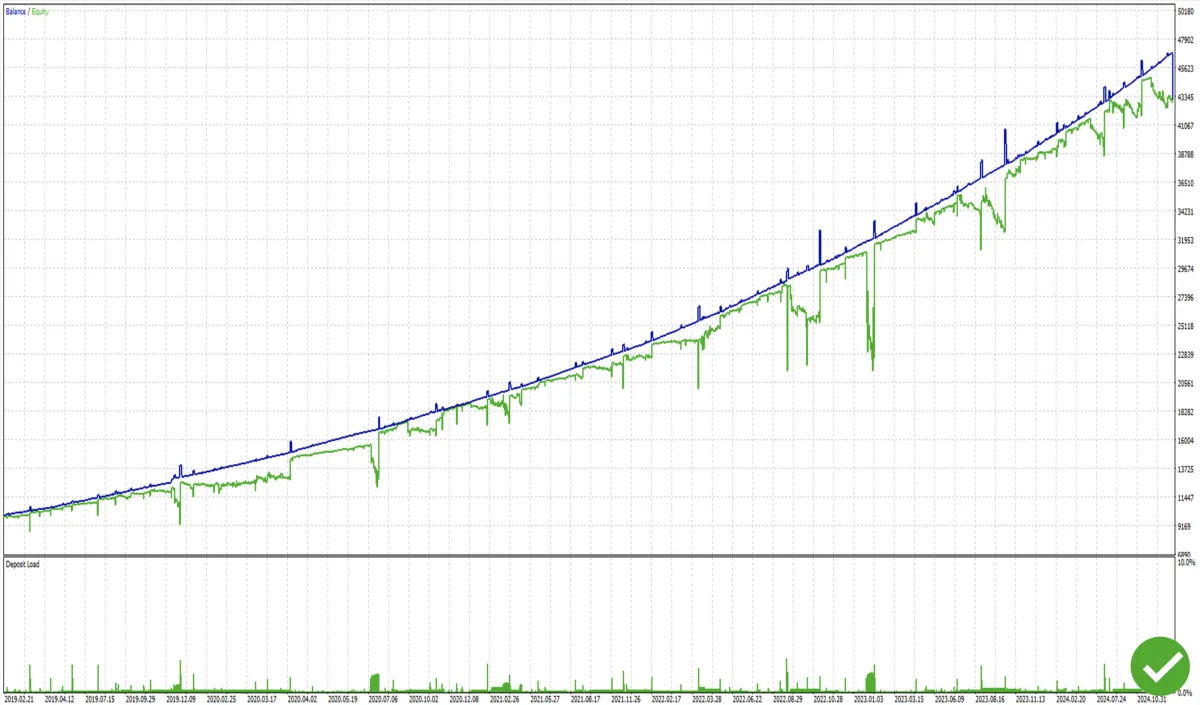
Backtests
2019-2024 Equity Growth
Our Philosophy: Defense First
We optimize until we’d trust the settings with our own capital. Profit matters—but risk matters more. We evaluate max drawdown, Sharpe ratio, profit factor, stagnation, and worst‑case sequences before we look at headline returns. As Paul Tudor Jones famously emphasized: defense over offense.
Engineered for Real-World Trading
We tune risk first, then return—so the equity curve aligns with real-world drawdown tolerance.

Risk-first
Controlled drawdowns, steady upside
Defense first: position sizing + time-of-day filters cap worst-case sequences.
Faster recoveries: shallow dips mean fewer days back to highs.
Live-ready: stress-tested on multi-year data, including crisis weeks.
Edge across regimes
Consistent, repeatable edge
Adaptive logic: rides trend, stays flat in chop, throttles risk on shocks.
Trend aware: MA + volatility gates avoid late chases.
Range smart: mean-reversion filters curb over-trading.
Built for real-world frictions
Robust to fees, spread, slippage, and news
All-in modeling: spread, commissions, swaps, slippage baked in.
Latency-safe: entry/exit rules tolerate imperfect fills.
Data-clean: outlier handling prevents curve-fit traps.
Bottom line: We favor settings we could personally run given our risk targets.
Browse Results by Pair
Many products don’t publish backtests. We publish settings, reports, and raw exports so you can verify the numbers yourself.
All numbers are based on starting with a $10,000 balance with a .01 to $3000 position size.

AUDCAD
Version: 4
Profit: 67.54%
Max DD: 18.4%
Sharpe: 0.66
Profit Factor: 2.05
Years tested: 2019-2024

AUDUSD
Version: 4
Profit: 88.91%
Max DD: 13.9%
Sharpe: 0.95
Profit Factor: 2.06
Years tested: 2019-2024

EURAUD
Version: 7
Profit: 29%
Max DD: 36.32%
Sharpe: 0.79
Profit Factor: 1.90
Years tested: 2019-2024

EURUSD
Version: 5
Profit: 87.97%
Max DD: 11.58%
Sharpe: 1.04
Profit Factor: 1.84
Years tested: 2019-2024

GBPAUD
Version: 6
Profit: 331.77%
Max DD: 30.39%
Sharpe: 0.77
Profit Factor: 1.83
Years tested: 2019-2024

GBPUSD
Version: 20
Profit: 280.82%
Max DD: 24.95%
Sharpe: 1.17
Profit Factor: 1.93
Years tested: 2019-2024

NZDCAD
Version: 5
Profit: 57.72%
Max DD: 10.64%
Sharpe: 0.68
Profit Factor: 2.03
Years tested: 2019-2024

NZDUSD
Version: 5
Profit: 88.80%
Max DD: 15.62%
Sharpe: 1.00
Profit Factor: 2.11
Years tested: 2019-2024

USDCAD
Version: 5
Profit: 131.55%
Max DD: 11.85%
Sharpe: 1.37
Profit Factor: 2.03
Years tested: 2019-2024

USDCHF
Version: 07
Profit: 67.38%
Max DD: 8.23%
Sharpe: 0.93
Profit Factor: 1.92
Years tested: 2019-2024

USDJPY
Version: 3
Profit: 89.77%
Max DD: 14.33%
Sharpe: 0.91
Profit Factor: 2.76
Years tested: 2019-2024

GOLD
Version: 29
Profit: 94.41%
Max DD: 32.93%
Sharpe: 0.58
Profit Factor: 2.82
Years tested: 2019-2024
Backtests are hypothetical and include cost assumptions; they don’t guarantee future results.
Costs Modeled—Not Assumed
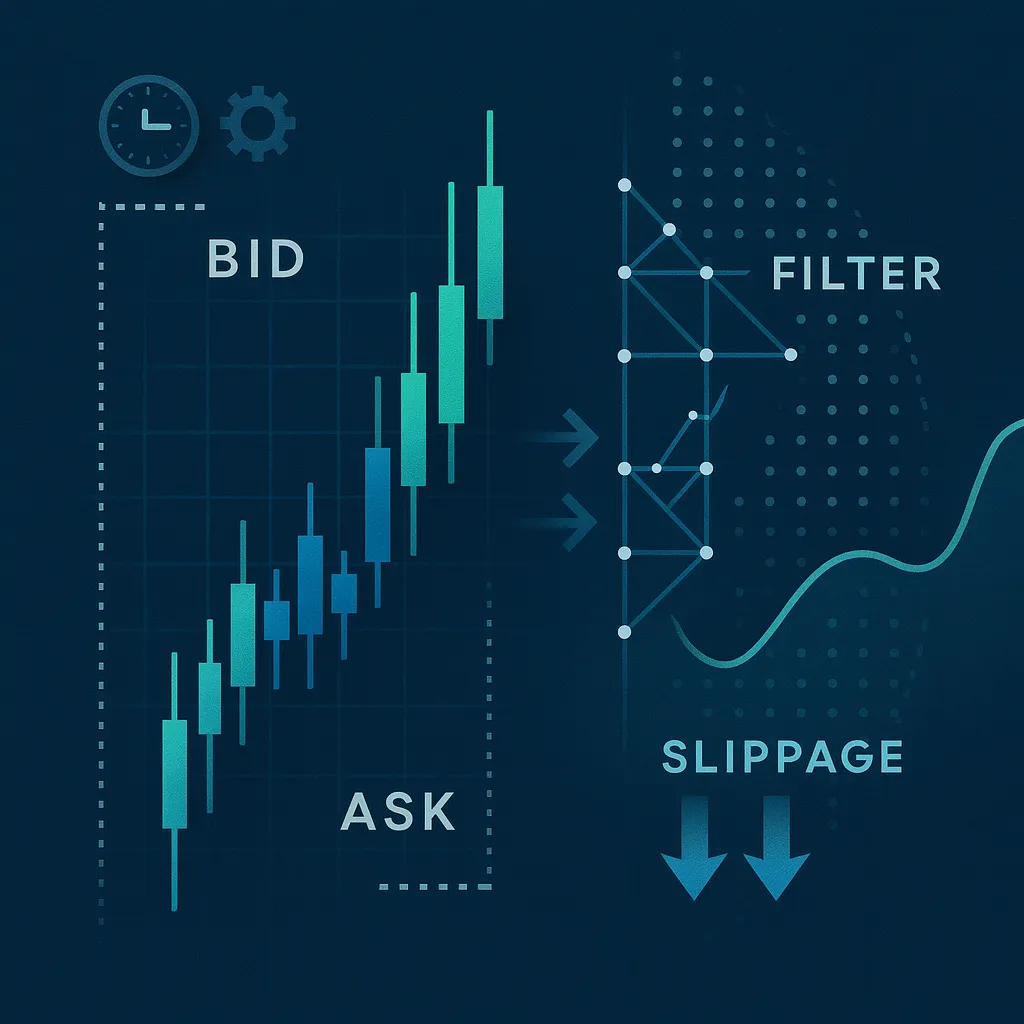
We backtest on bid/ask tick data with historical spreads, then layer commissions and conservative slippage so results reflect real fills—not perfect ones.
Spread: historical • Commission: $7.00 / lot • Slippage: 0.50 • Model: Every tick (bid/ask)
MEET THE FOUNDER & COO
Hey, I'm Bill!
“Backtests are the starting line, not the finish. We pair multi-year, cost-adjusted tests with forward checks and live tracking. That’s how we keep risk disciplined and expectations realistic.” — Bill Wynne, COO

Institution-Grade Tick Data (Bid/Ask, Not Just Candles)
We backtest on true bid/ask ticks with modeled costs, so results aren’t flattered by ideal fills.
We import tick-by-tick Dukascopy history with real bid/ask quotes. Tests include historical spreads, intrabar volatility, broker-like commissions, and conservative slippage, so the equity curve reflects what traders actually experience.
Why it matters
✅ Intrabar accuracy: tick granularity avoids the “candle-only” blind spots.
✅ Realistic costs: historical spread + commission + modeled slippage.
✅ Reproducible: fixed data window and settings; results you can rerun.


Data provider & loader used.
We backtest on true bid/ask ticks with modeled costs, so results aren’t flattered by ideal fills.
Backtests are hypothetical and use historical data and cost assumptions. They don’t guarantee future results.
Tested Through Multiple Market Regimes (2019 → Today)
Markets evolve. We backtest across multi-year windows that include crisis spikes, range-bound periods, and policy-driven volatility. Where data allows, we extend to 10 years for deeper regime coverage.

2019-2020
COVID shock & reaction

2020-2021
Post-COVID trend & chop
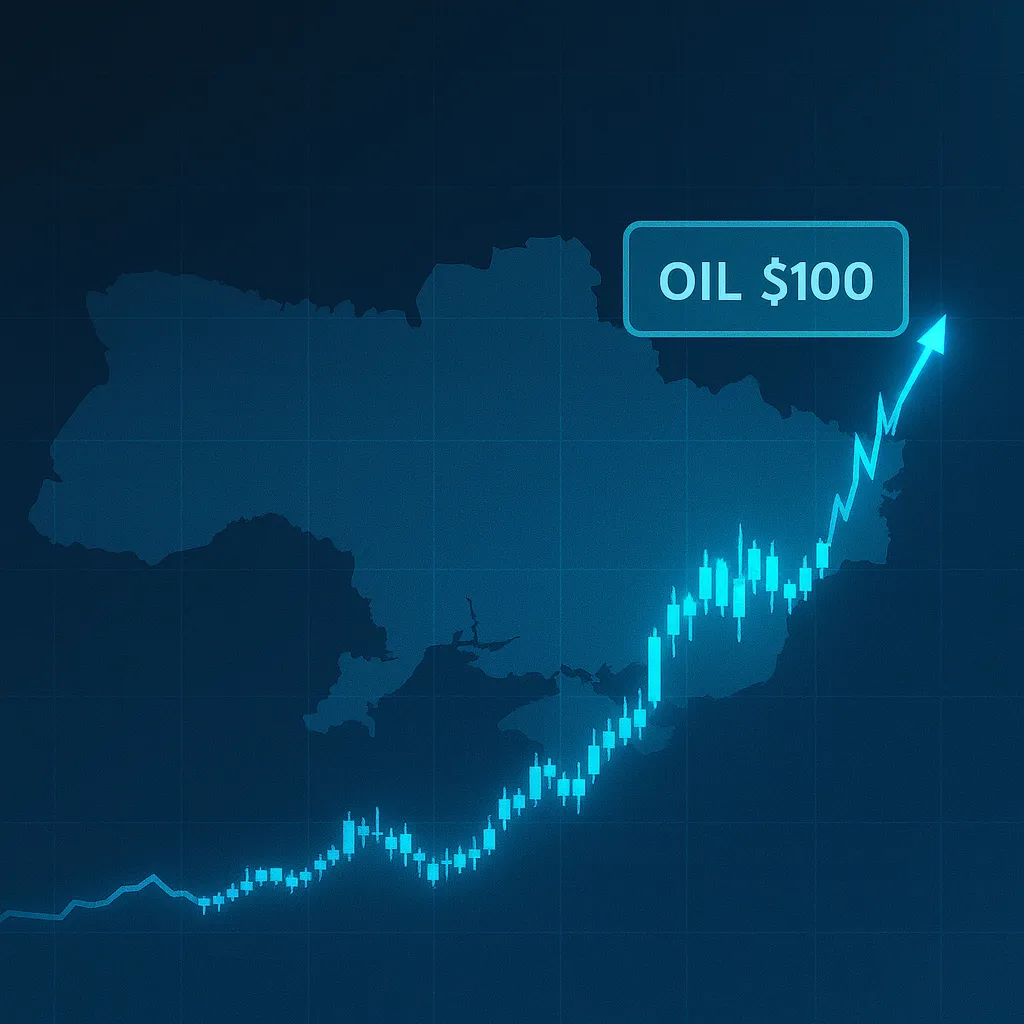
2022 → present
Ukraine–Russia conflict
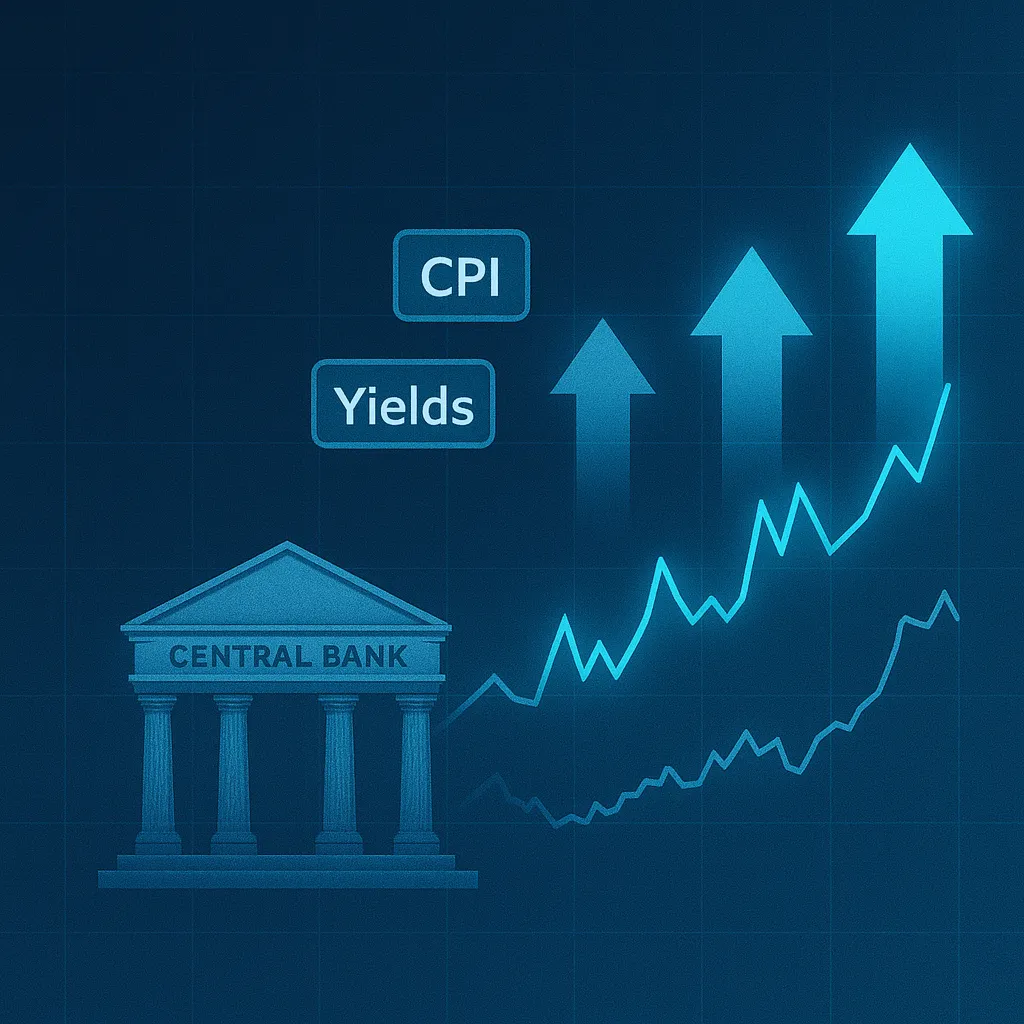
2022-2024
Inflation/Rate cycle volatility and shocks
2024 → present
Normalization / Mixed regimes
Coverage: 2019-present | Max coverage: Up to 10 years where available | Data granularity: Every tick (bid/ask)
See the Backtest, Step-by-Step (No Edits, Full Screen Capture)
We record the test from setup to results—data source, model (Every tick), bid/ask, commission & slippage, and verification steps. You see the process, not just the outcome.
Dukascopy • Tickstory • MT5 Strategy Tester
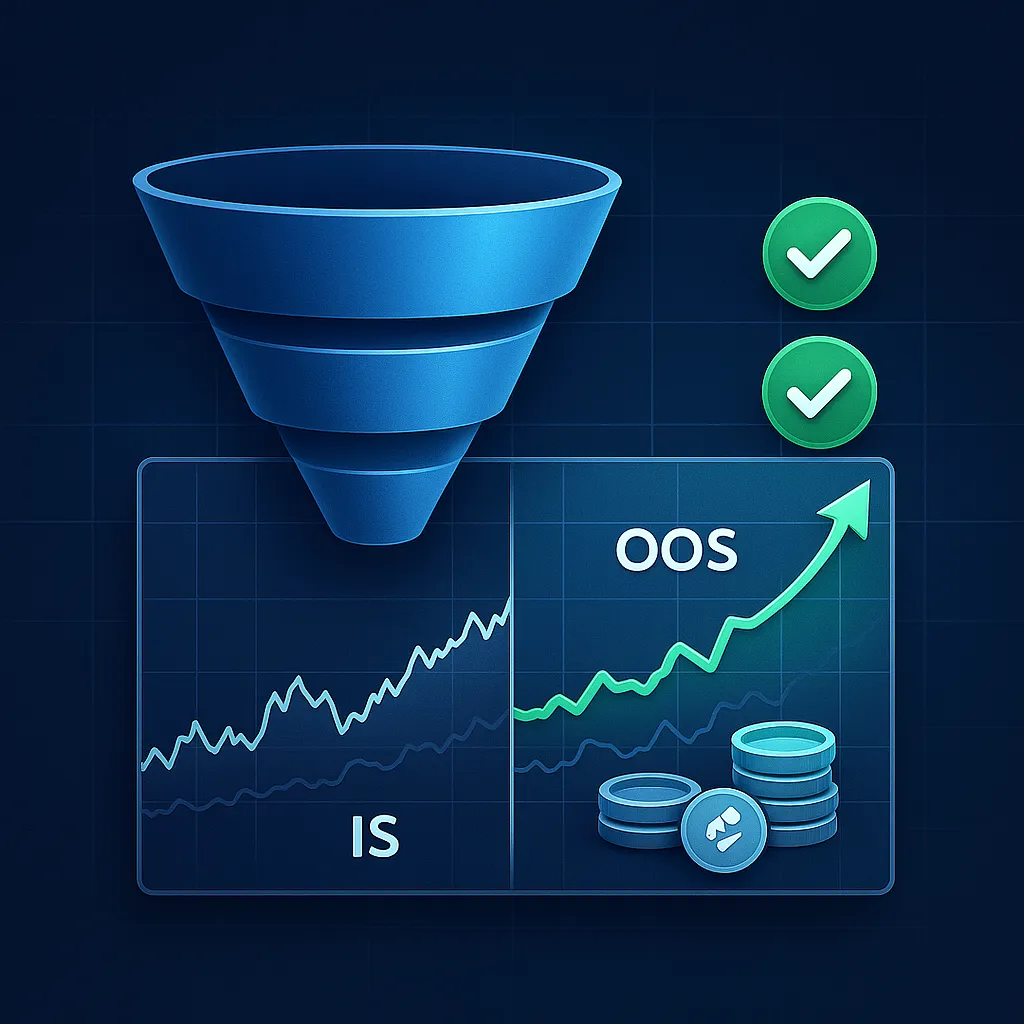
What It Takes: 4–6 Weeks Per Pair
Optimization and validation aren’t one-click. We iterate 4–6 weeks per pair through parameter ranges, forward testing, and out-of-sample checks before a profile is green-lit—then re-optimize every 3–6 months as markets change.
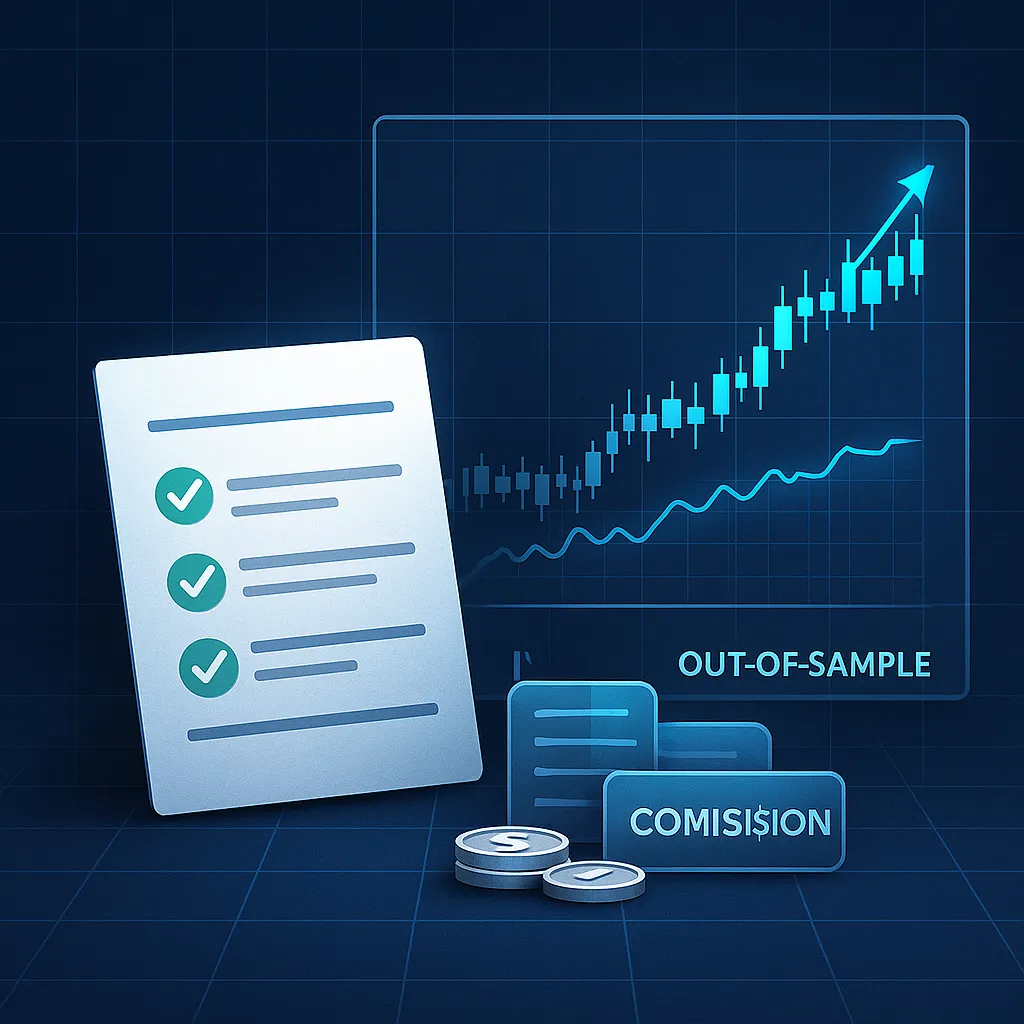
Checklist we complete per pair
✅ Define risk targets: max drawdown cap, profit-factor/Sharpe guardrails
✅ Grid search → shortlists: prune to a few robust parameter clusters
✅ Walk-forward / OOS check: confirm the edge outside the fit window
✅ Monte Carlo sensitivity: trade-order & slippage permutations (when applicable)
✅ Cost & liquidity stress: widened spreads, realistic commission + slippage
✅ Sign-off package: settings file + test report + screen-capture video

Week 1
Data audit & targets
Week 2-3
Grid search
Week 4
Shortlist + OSS
Week 5
Monte Carlo + costs
Week 6
Sign-off package
Acceptance criteria (pair-specific):
✅ Meets risk targets, passes OOS, and remains profitable after modeled costs.
Model: Every tick (bid/ask) • Costs: spread + commission + slippage • Re-opt cadence: 3–6 months
The Result: profiles that have delivered consistent, cost-adjusted performance since 2015.
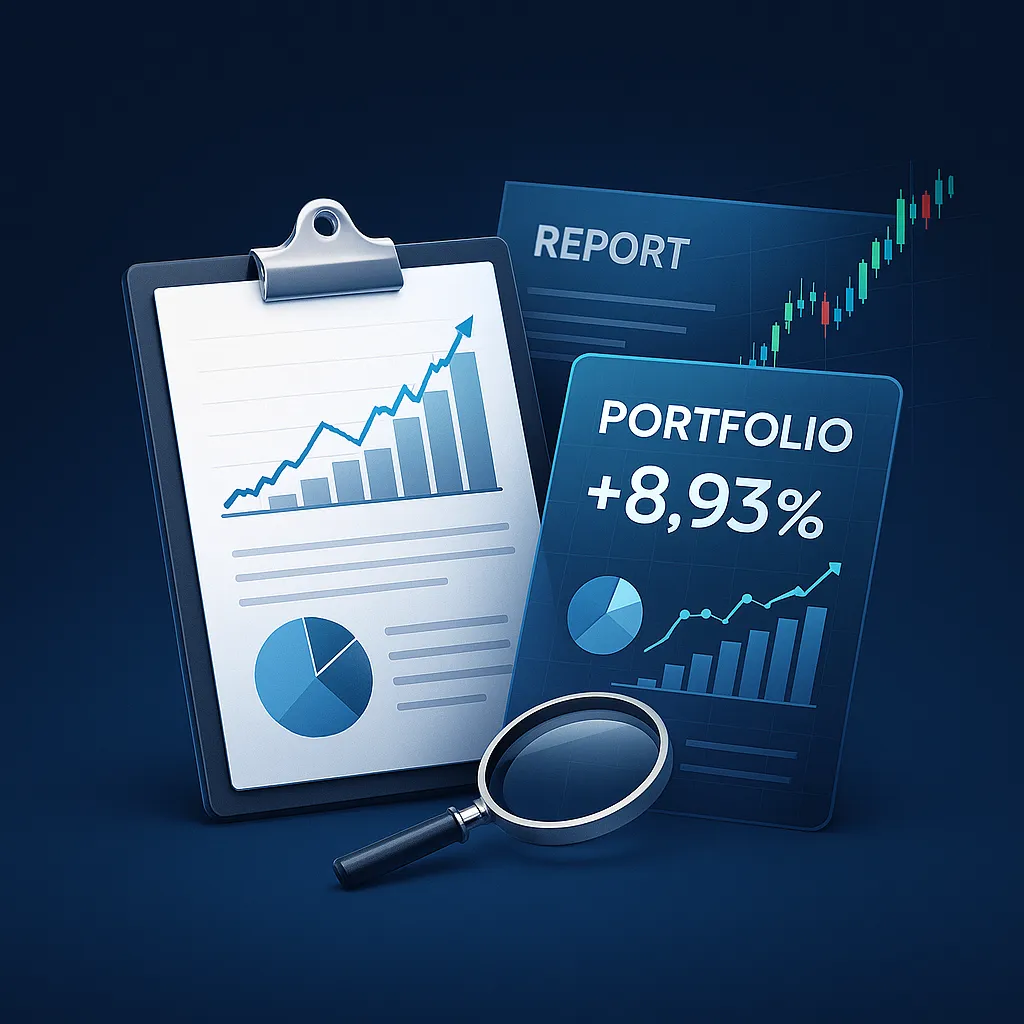
How to Read the Results
Key metrics you’ll see on every card
✅ Max Drawdown (DD): deepest equity dip → lower is safer. Good: ≤ 10–20%
✅ Sharpe Ratio: return ÷ volatility → smoother equity. Good: ≥ 0.06; Strong: ≥ 1.0
✅ Profit Factor (PF): gross profit ÷ gross loss → edge quality. Good: ≥ 1.3; Strong: ≥ 1.5
✅ Win Rate & Expectancy: quality > quantity (avg $ per trade).
✅ Stagnation (days): longest flat/down run → patience test.
✅ Trade Count: sample size → more trades = more stable stats.
✅ Worst Day / Week: stress markers for sizing.
Tip: Always judge PF/Sharpe after costs (spread, commission, slippage).
Risk presets you can toggle
✅ Conservative: 0.01 / $5,000
✅ Balanced: 0.01 / $3,000
✅ Custom: Your inputs in our Risk Modeling Tool
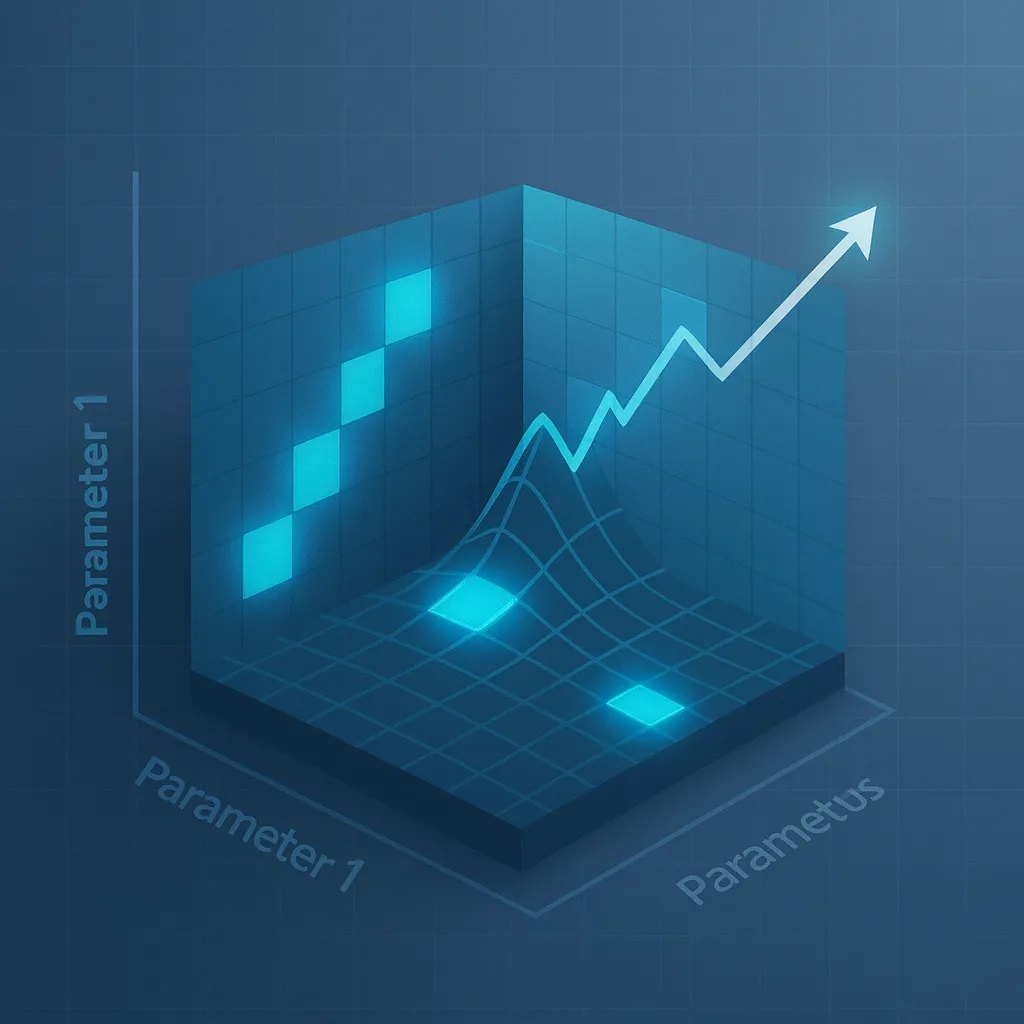
Built to Avoid Curve-Fit Traps
Short windows can make anything look great. We test across multiple years and market regimes, then validate on out-of-sample (OOS) data so the edge survives outside the fit.
How do we check for curve-fit risk
✅ Stability across parameters: neighboring settings perform similarly (no razor-thin peak).
✅ Regime consistency: trend, range, and shock periods are still net positive.
✅ OOS degradation: performance drop ≤ X–Y% vs. in-sample is acceptable and expected.
(Typical target: ≤ 20–30%)
Bottom line: profiles only ship if they pass OOS and stay profitable after fees & slippage.
Even when a product has a backtest, ensure it’s not curve-fit—ask for OOS results.
Backtests are hypothetical and based on historical data and cost assumptions. They do not guarantee future results.
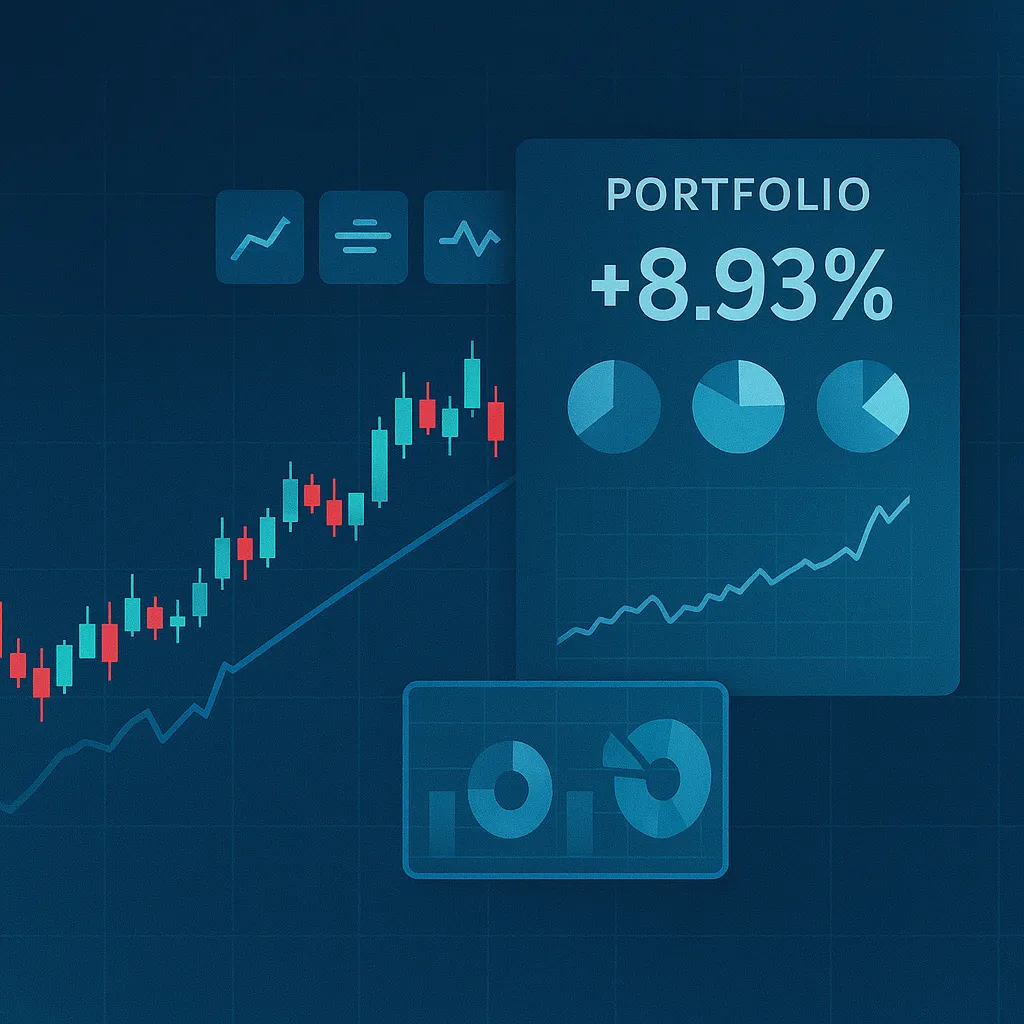
Profit, Protected
We optimize for risk-adjusted return. If a setting lifts profit by tolerating outsized drawdowns, it doesn’t ship. We’d rather deliver steadier equity than fragile peaks.
Guardrails: Max DD cap, Sharpe ≥ 1.0, PF ≥ 1.3 (after costs)
Set Risk to Fit Your Account
Use our Risk Modeling Tool to size positions to your tolerance. You control the dials; we show the projected drawdown and return after costs.
Inputs
Account size
Risk/lot
Max DD cap
Pairs traded
Outputs
Projected Max DD
Net/Annual Profit
Profit Factor
Win Rate
Example: $10k account at .01 to $3000 → Projected Max DD 9–12%, Worst Week –3.6%, Position 0.03 lots
Projections are estimates based on historical data and cost assumptions; they aren’t guarantees.
Hands-Off Option: Same Engine, Managed for You
Prefer not to run it yourself? Our social trading programs use the same core software and risk guardrails. Availability is jurisdiction-dependent and may be limited. Performance fees may apply.
OOS-Validated
Costs Modeled
Defense Focused
No Monthly Cost
Programs are offered by third-party providers where permitted. Past results are hypothetical/backtested unless noted; they aren’t guarantees.
From Struggling to Profitable
Hear From Real Traders

Pros: Trades feel cleaner and more thought out. You can tell it’s more advanced and really sophisticated. Cons: The settings screen was kinda confusing at first but I figured it out. Overall: Kraitos Elite feels like an upgrade in every way. If you’re looking for smarter trades and don’t mind learning a bit, this is the one to go with.


Wow, what a firm! Wow, after almost 5 years of trying to be in profit by myself I finally can tell that because of softwares from this company I'm profitable trader 💪🏻 Keep it up like that, amazing, amazing 👋🏻


Pros: It’s smarter with entries, you can tell. Avoids dumb trades and seems to know when to chill. Absolutely great software Cons: Takes a sec to learn the settings if you’re not used to this stuff. Overall: I’m happy I switched to Elite. After testing it a bit, it’s def better if you want something more polished. It’s not magic, but it’s close enough for me lol.


First three months are profitable... I started to use Kraitos just after the start of the new year and about to end the first quarter and I am impressed. I am familiar with EAs and the way Kraitos enters and manages trades is great with almost no drawdown. I did start with 5k so the monthly returns have been positive. I decided to add more capital at the 3 month mark. Thank you Auvoria Prime.

Pros: Elite trades with precision. It’s not rushing in like the others, but that’s a good thing. I noticed better-quality setups, fewer unnecessary trades, and a smoother equity curve. It really feels like it’s thinking ahead. Cons: You gotta spend a little time learning the setup options—more detailed than basic Kraitos. Overall: Kraitos Elite is the EA I go to when I want the safest hands managing my trades. It has the most control and flexibility. Worth the upgrade for sure if you're ready to take it a bit more seriously.

I’ve been trading with Kraitos & KraitosX, and all I can say is that it’s awesome. I’ve made around 5% this month, and there’s still one more week to go. I would recommend it to everyone.

FAQs
Q: Why do you focus so much on drawdown and Sharpe?
A: Because survival and consistency beat one‑hit wonders. Large drawdowns ruin compounding and investor confidence.
Q: Can I see the raw reports?
A: Yes—every strategy card has direct links to the Strategy Tester HTML/PDF, equity PNG, and settings excerpt.
Q: Why 2019 as a minimum start?
A: It gives us multiple regimes (COVID, geopolitics, inflation/rates) to test robustness. Where data allows, we extend to ~10 years.
Q: Are your tests curve‑fitted?
A: We explicitly test for overfit via out‑of‑sample checks, stability around parameters, and stress tests (wider spreads/slippage). If a profile is brittle, we don’t ship it.
Q: Do you guarantee results?
A: No. Markets are uncertain. We publish realistic tests, teach risk, and give you the tools to decide.
If your question isn’t here, our team is ready to help — but don’t wait too long, this offer ends soon!
This Is Your Moment — Don’t Let Another Month Pass Without Automation
✅ 6 Years of Tested Data – so you can trade with confidence, not guesswork.
✅ Verified Live Performance – results you can trust, not just hype.
✅ 24/7 Automation + Risk Management – your account works even while you sleep.
✅ Cancel Anytime – total flexibility, zero risk to get started.


Financing Available — Start Today, Pay Over Time
Secure checkout • Backed by data • Trusted by real traders
Trading foreign exchange and CFDs involves significant risk of loss and is not suitable for all investors. Only risk capital should be used.
Important
Past performance is not indicative of future results.
✓ Backtests are hypothetical; they use historical data and assumptions (e.g., spreads, slippage, commissions) that may differ from live trading. Hypothetical performance is limited by hindsight and cannot account for real‑world liquidity, latency, execution quality, or psychological impacts.
✓ We sell software and educational tools. We do not provide personalized investment advice. You control your account and risk settings.
✓ Social trading options, if available to you, may constitute managed accounts in certain jurisdictions and involve additional risks and fees. Access is subject to eligibility and local regulations.
✓ By using our products, you agree to our Terms, Risk Disclosure, and EULA.
Trading involves risk. Past performance and backtests do not guarantee future results. Only risk capital you can afford to lose.
We do not provide financial advice.
We respect your privacy. Your information is used to tailor your demo and will never be sold.
